What We Offer
Analytics & Dashboard Development
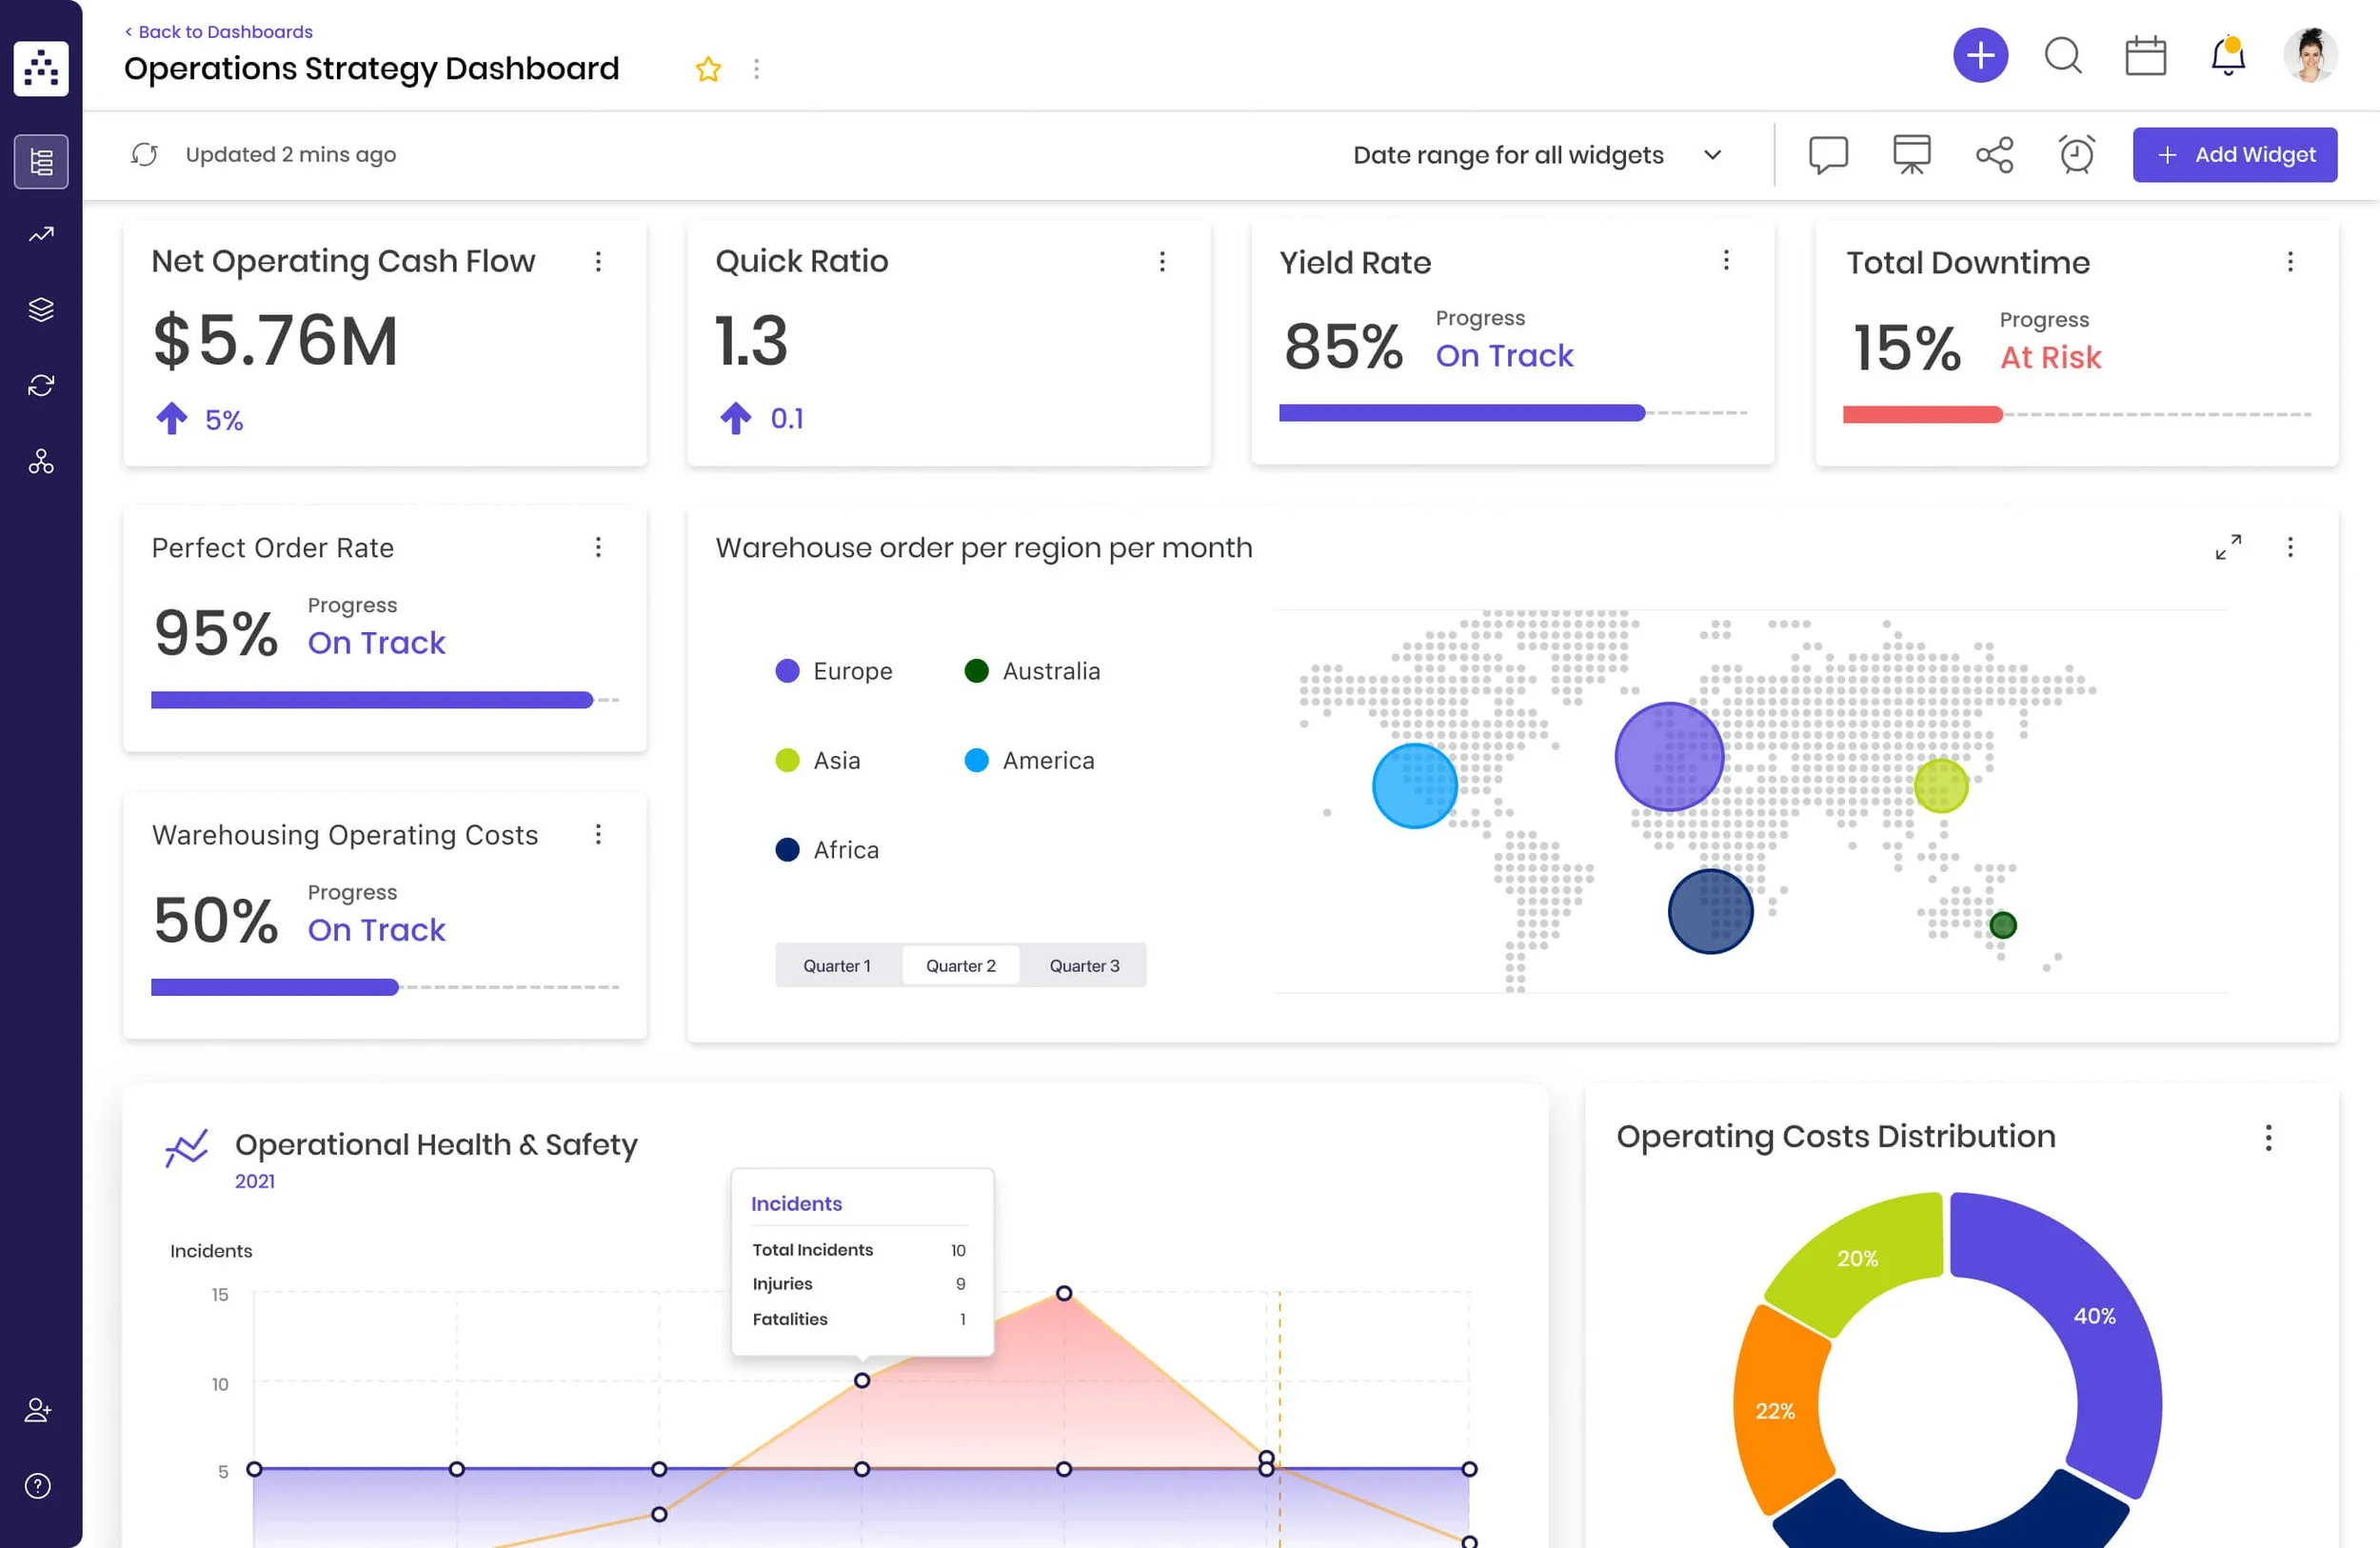
We build clear, reliable dashboards that turn your data into a single source of truth—giving leadership visibility into performance and key drivers.
IncludedData source audit and metric definition
Dashboard architecture and build (in your existing toolstack)
KPI alignment session with leadership
Documentation and handoff so your team can maintain it
30-day post-launch support window
Sales & Lead Optimization
IncludedFunnel analysis and conversion diagnostic
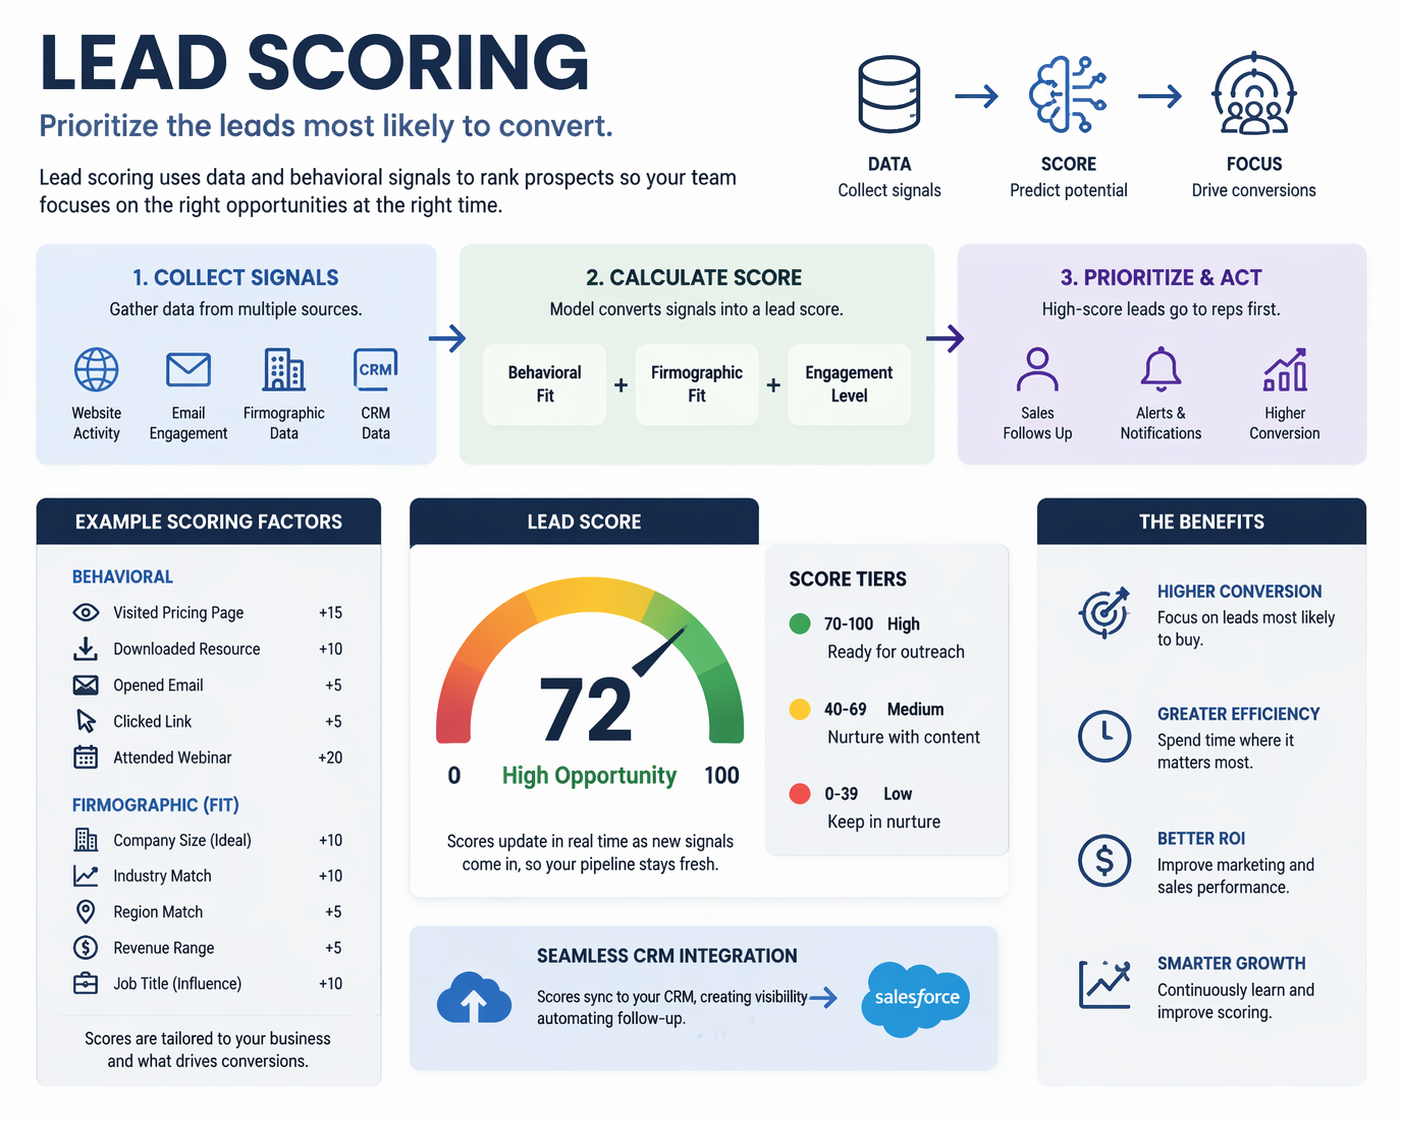
Lead scoring model design and implementation
Sales and marketing alignment workshop
Playbook documentation with update instructions
Codebase ownership transferred to client
We help you identify and prioritize your highest-value opportunities by analyzing your funnel and implementing lead scoring systems that improve conversion and sales efficiency.
Financial Modeling & Decision Support
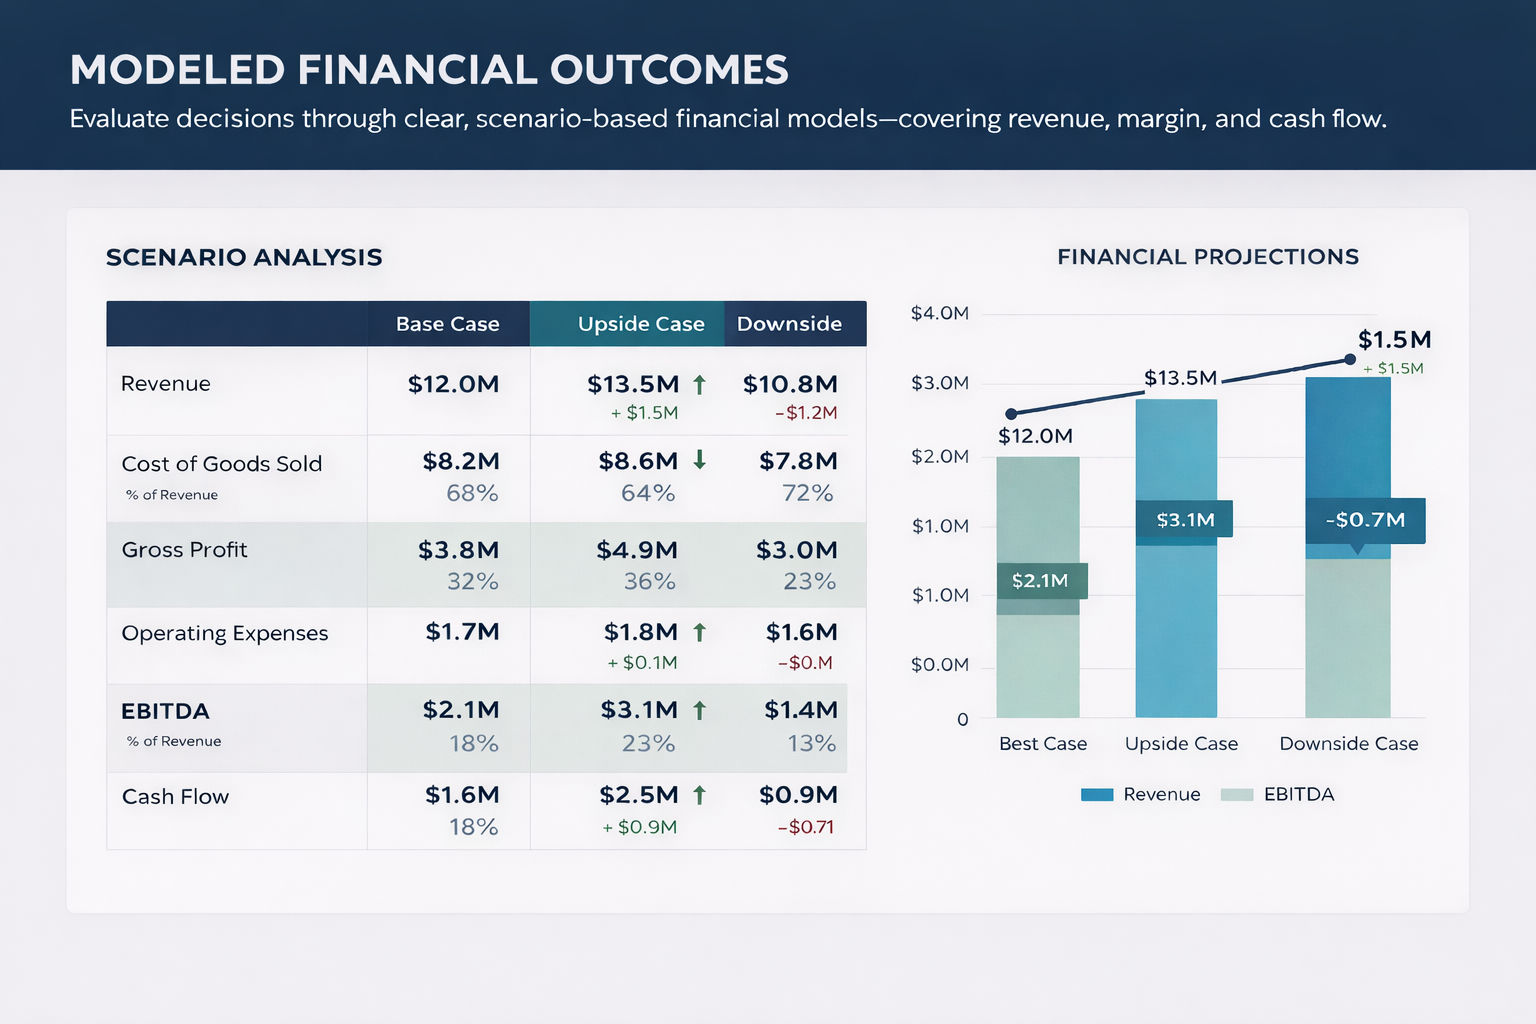
IncludedThree-statement or decision-specific model build
Scenario and sensitivity analysis
Assumption documentation and audit trail
Executive summary memo with recommendations
Model walkthrough session with key stakeholders
Data Science
IncludedProblem framing and data readiness assessment
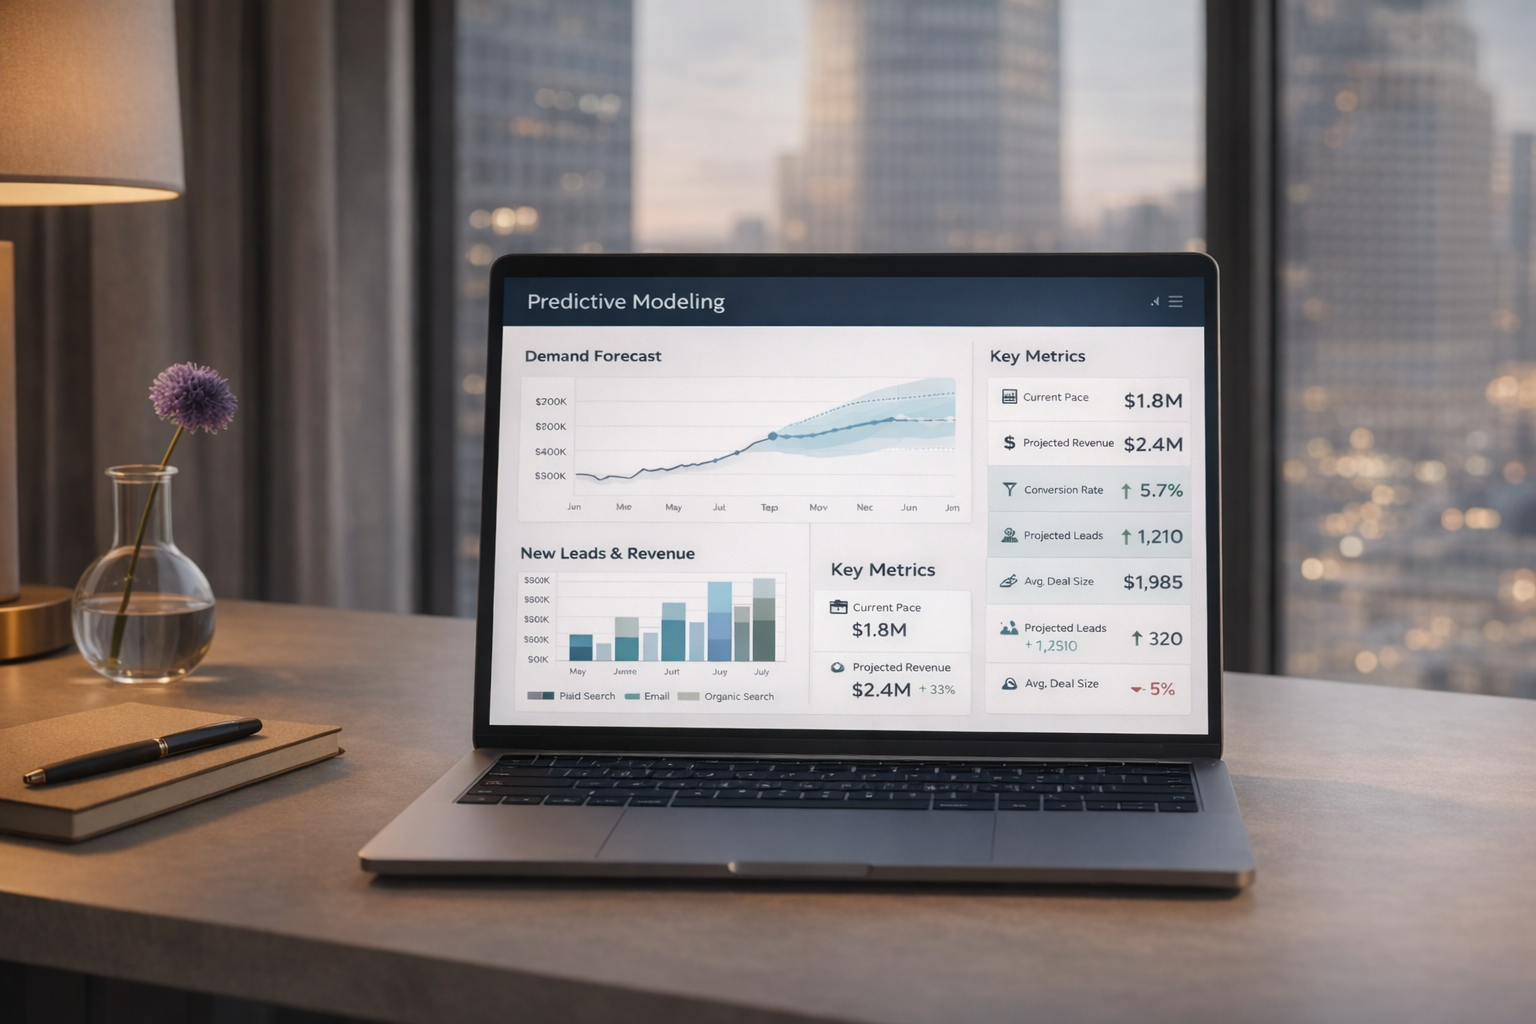
Predictive model development and validation
Integration guidance for operational or financial workflows
Plain-language summary of model logic and limitations
Ongoing model monitoring recommendations
We build predictive models that help you anticipate what's coming and act before it's a problem. Our work spans churn and retention modeling, demand and revenue forecasting, lead scoring, and pricing optimization — applied across both early-stage companies building these capabilities for the first time and established operators looking to sharpen decisions they're already making.
Every engagement starts with a clear business question, not a dataset. We scope models to be accurate and interpretable, and we deliver them in a way your team can actually use — with documentation, validation results, and guidance on how to operationalize the output in your financial or commercial workflows.
Get In Touch
If you're interested in working with us, complete the form with a few details about your project. We'll review your message and get back to you within 48 hours.